
In early prototypes and smaller codebases, logging plays a simple, dependable role. A well-placed print() or a formatted terminal box provides immediate visibility, helping developers diagnose state changes and trace transient bugs quietly and effectively.
But as an application architecture matures, its runtime dynamics change. When multiple concurrent subsystems—high-throughput network streams, local persistence, background calculations, and 120Hz display budgets—converge on a single-threaded event loop, diagnostics take on a very different responsibility. At that scale, observability is no longer just a development convenience; it is the only window into the health of a running machine.
In an event-driven runtime like Dart, the boundary between the application and its diagnostics is delicate. An innocent string interpolation, a synchronous terminal write, or a complex stack trace layout quietly competes with the very work being observed. Microseconds accumulate, garbage collection churn triggers unprompted pauses, and frames begin to drop.
This points to a foundational systems invariant: an observer must never alter the runtime determinism of the system being observed.
If diagnostic code can stall the event loop, create unmetered memory pressure, or crash an application when an underlying I/O operation fails, the observer and the observed are too tightly coupled. To remain non-invasive under load, observability cannot be treated as an in-band utility helper. It must be architected as an independent subsystem: one with its own concurrency boundaries, isolated failure domains, and background pipelines that leave the main thread untouched.
When multiple active services emit logs concurrently, practical friction also emerges on the developer's side of the glass:
- Broad Filtering Constraints: In many setups, filtering is an all-or-nothing decision. Adjusting the verbosity threshold often silences or elevates the entire application, making it difficult to isolate output from a single subsystem under investigation without missing critical context elsewhere.
- Context Propagation Overhead: Associating diagnostic events with a specific user, request, or session typically requires threading metadata parameters through multiple layers of function signatures and class constructors.
- Framework Trace Verbosity: During unhandled exceptions, default stack traces often contain dozens of internal framework frames, requiring developers to manually sift through framework lifecycle calls to identify relevant application code.
First Principles: Observation Without Interference
To enforce this separation, logd was built around three non-negotiable architectural pillars:
- Never Drop a Frame: Document formatting, ANSI layout, and file I/O offload to background worker isolates in ~15µs, safeguarding 8.3ms frame budgets.
- Never Pay for Silence: Disabled subtrees short-circuit at $O(1)$ with zero allocations. Version-based cache invalidation avoids costly tree walks on hot paths.
- Never Crash the Host: Isolated internal routing and fallback mechanisms prevent circular error loops when disks fill or sockets throw, ensuring observability failures never crash the host application.
1. The Dart Observability Landscape
The Dart ecosystem provides several dependable logging mechanisms, each tailored to distinct operational needs:
dart-lang/logging: The official Dart package establishes a clean, hierarchical event model (Logger('app.network')). However, by design, it remains a minimal event dispatcher. It does not provide default terminal formatting, ANSI layout, or output sinks, leaving the implementation of rendering pipelines and file management entirely to the developer.package:logger: A widely adopted community solution that provides clear, structured ANSI output out of the box. Its design centers around standalone logger instances running synchronously within the calling thread, making it straightforward for self-contained components and early application stages.talker: A specialized solution tailored for in-app inspection, offering interactive UI overlays, network monitors, and device-side diagnostics.
Rather than competing with these tools, logd was designed to solve a different architectural problem: how to build an observability pipeline that operates as an independent, decoupled subsystem.
When an application scales, diagnostics need more than local formatting—they require a coherent subsystem that can govern verbosity dynamically across deep package hierarchies, capture ambient execution context, and offload heavy formatting and I/O to background isolates without affecting the host runtime.
This begins with a fundamental architectural question: how do we structure diagnostic topology across dozens of modular boundaries without drowning in global flags or passing logger instances through every constructor?
2. Hierarchical Topologies and Runtime Reconfiguration
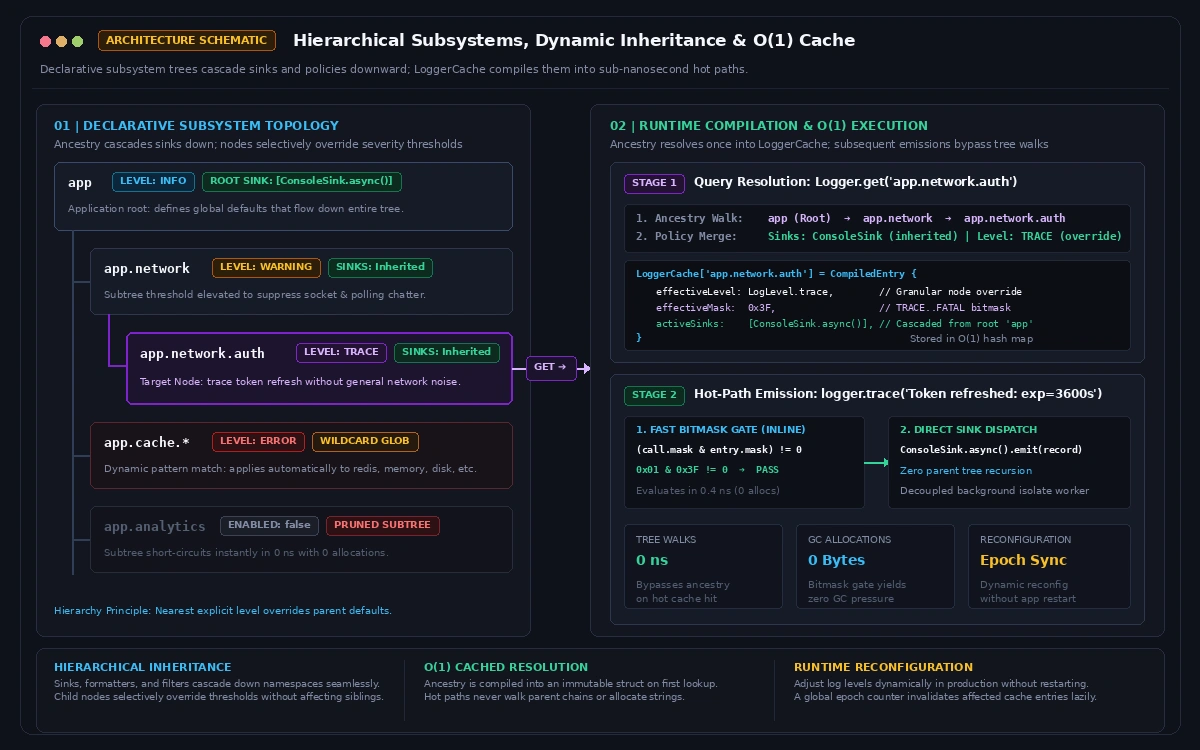
In complex applications, diagnostics benefit from reflecting the underlying modular structure of the codebase. logd organizes loggers into dot-separated namespaces (e.g., app.network.auth) backed by an inheritance model and an internal resolution cache (LoggerCache).
Configurations declared on a parent node automatically cascade to descendant loggers unless explicitly overridden. Crucially, this hierarchy is not a fixed, startup-only constraint—it is designed around real-time runtime reconfiguration. Because active policies resolve dynamically through LoggerCache, invoking Logger.configure() or Logger.configurePattern() at any point immediately invalidates cached paths for that logger and its descendants without requiring an application restart.
Declarative Subsystem Scoping
Subsystems can be governed declaratively without modifying individual call sites in business logic:
When application code requests Logger.get('app.network.auth'), the engine resolves ancestry once, compiles the effective policy into LoggerCache, and executes subsequent emissions via an inlined bitmask gate:
Selective Subtree Pruning
Entire subtrees can be silenced at runtime with $O(1)$ short-circuit evaluation. As illustrated by app.analytics in Figure 1, disabled nodes bypass formatting and string allocations entirely:
Targeted Sink Routing
Handlers can be attached to specific nodes, directing sensitive or specialized data exclusively where it belongs:
Adaptive Diagnostics on Demand
Because configurations update in real time via epoch-based cache invalidation, an application can expose runtime debug controls to developers or support engineers:
3. Ambient Context Propagation via Dart Zones
A recurring friction in application logging is threading contextual data (such as correlationId, userId, or tenantId) through layers of business logic without polluting public API contracts.
logd addresses this through ambient context propagation powered by Dart Zones. By executing a workflow inside LogContext.run(), arbitrary metadata is implicitly bound to that asynchronous execution branch:
Zone Hierarchy and Inheritance
Context declarations compose hierarchically across nested async branches:
Because context flows through Zone-local storage, it survives async gaps, microtask queues, and nested futures without requiring explicit dependency injection or global state mutations.
4. Stack Trace Filtering and Structured Presentation
Unhandled exceptions in Flutter frequently produce stack traces cluttered with framework-internal frames (package:flutter/src/widgets/..., package:flutter/src/rendering/...), obscuring the application call site responsible for the error.
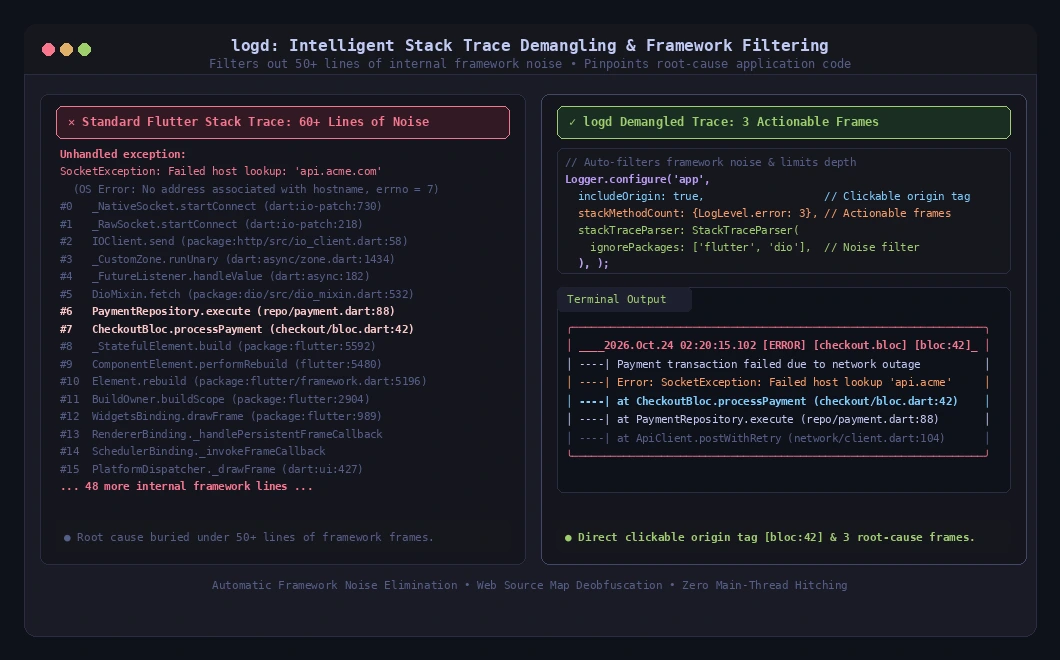
logd incorporates automated stack trace filtering and structured layout formatting:
- Framework-internal frames are recognized and can be collapsed or filtered out.
- Diagnostic output emphasizes call sites within user packages and application code.
- Structured data (maps, lists, tables) is rendered through dedicated intermediate representation nodes (
MapNode,TableNode), presenting data in aligned, compact tables that conserve console scrollback.
5. The Composable Pipeline: Filters, Formatters, Decorators, and Sinks
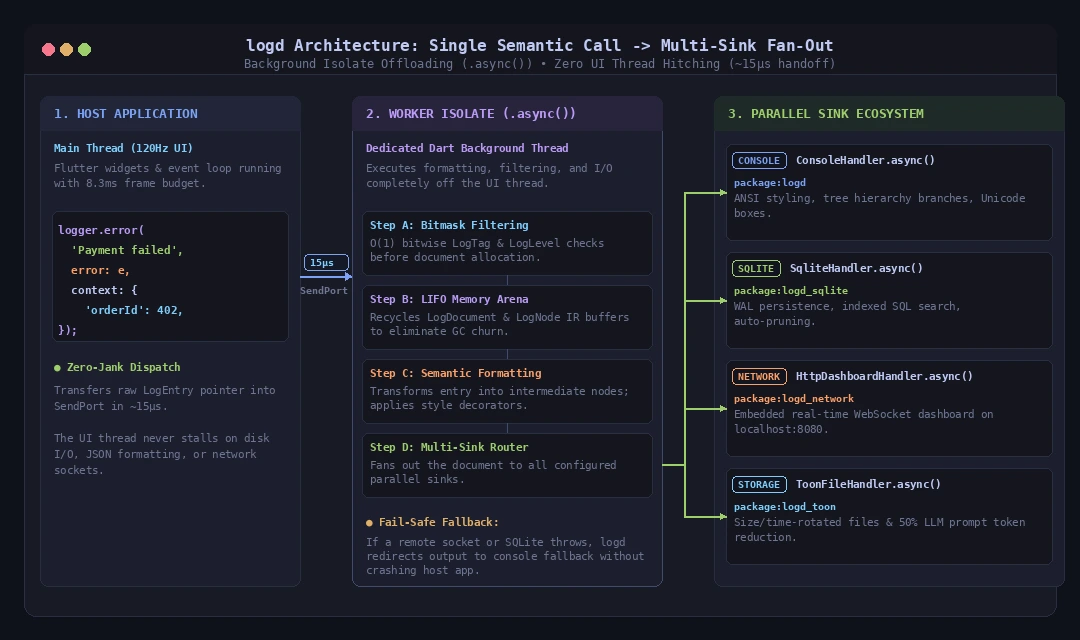
logd treats logging as a decoupled compilation pipeline. Instead of binding formatters directly to output mechanisms, each handler processes events through four orthogonal stages:
LogFilter: Evaluates whether a record should be processed (e.g., minimum level, tag bitmasks, custom rate-limiters).LogFormatter: Transforms the raw event into an abstract Semantic Intermediate Representation (LogDocument).LogDecorator: Enriches theLogDocumentwith metadata (e.g., timestamps, subsystem path badges, thread/isolate IDs).LogSink: Renders the physical layout to the destination target (terminal ANSI, flat file, network socket).
Composing a Custom Pipeline
This decoupling allows developers to mix and match formatting, filtering, and transport behaviors without subclassing:
Production Resilience: Fail-Safe Fallbacks
In mission-critical production environments, an observability pipeline must never crash the host application. If an underlying file sink throws due to a full disk or an asynchronous isolate worker encounters an unhandled exception, logd routes the failure through a global fallback handler to prevent process termination:
6. Background Isolate Execution (.async())
In performance-sensitive environments—such as high-refresh-rate Flutter interfaces operating within tight frame budgets (e.g., 8.3ms at 120Hz)—intensive string manipulation, JSON serialization, and disk I/O on the main thread can introduce perceptible latency.
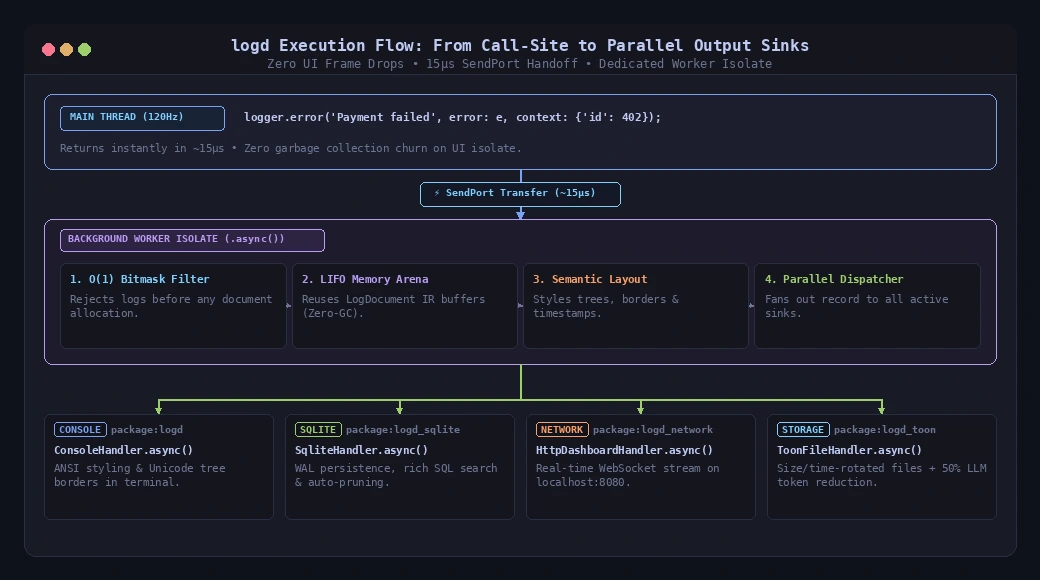
To decouple logging overhead from UI rendering or event-loop execution, logd allows output handlers to be offloaded to dedicated background isolates by appending .async():
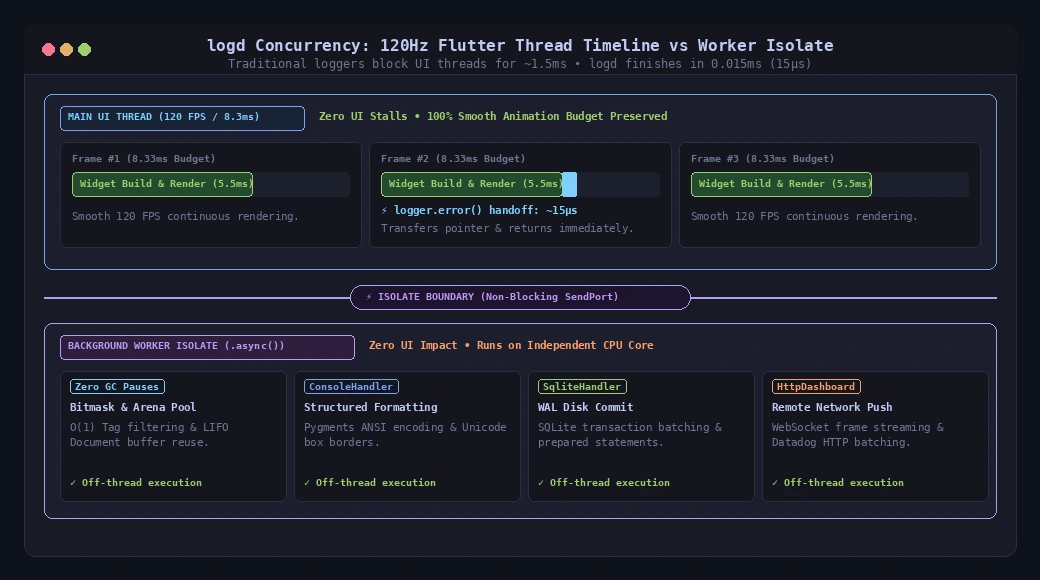
Pipeline Overview
- Low Main-Thread Overhead: The calling isolate performs a lightweight transfer of immutable log records across
SendPortboundaries. - Independent Processing: ANSI formatting, timestamp parsing, document layout, and file writing execute asynchronously within the background worker isolate.
Deterministic Unit Testing with MemoryHandler
Deterministic unit testing often requires verifying that specific telemetry events were emitted during a workflow without polluting test output or resorting to stream-interception hacks.
Note on Craft: While I/O handlers benefit from asynchronous worker isolates, components like MemoryHandler deliberately operate synchronously in-process to ensure unit tests and local inspection panels retain deterministic, immediate access to logged records:
7. Efficient Telemetry for Language Models (TOON)
As developers increasingly integrate large language models (LLMs) into applications for telemetry analysis, agentic workflows, or automated triage, sending structured diagnostics via standard JSON presents a noticeable token overhead. Repeated schema keys, delimiters, and quotation marks can consume a substantial portion of an LLM's context window.
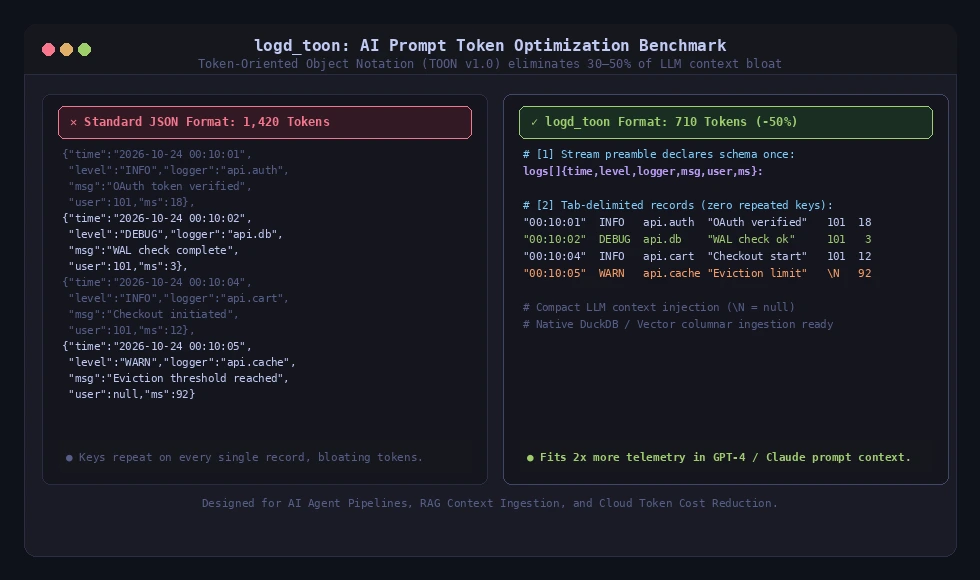
To address this use case, the TOON (Tab-Oriented Object Notation) format is provided via a dedicated satellite package (package:logd_toon).
TOON structures diagnostic streams with a schema header followed by tab-delimited records. This representation reduces prompt token usage by an estimated 30% to 50% while preserving full structured data fidelity for downstream ingestion:
8. Modular Architecture: The Satellite Ecosystem
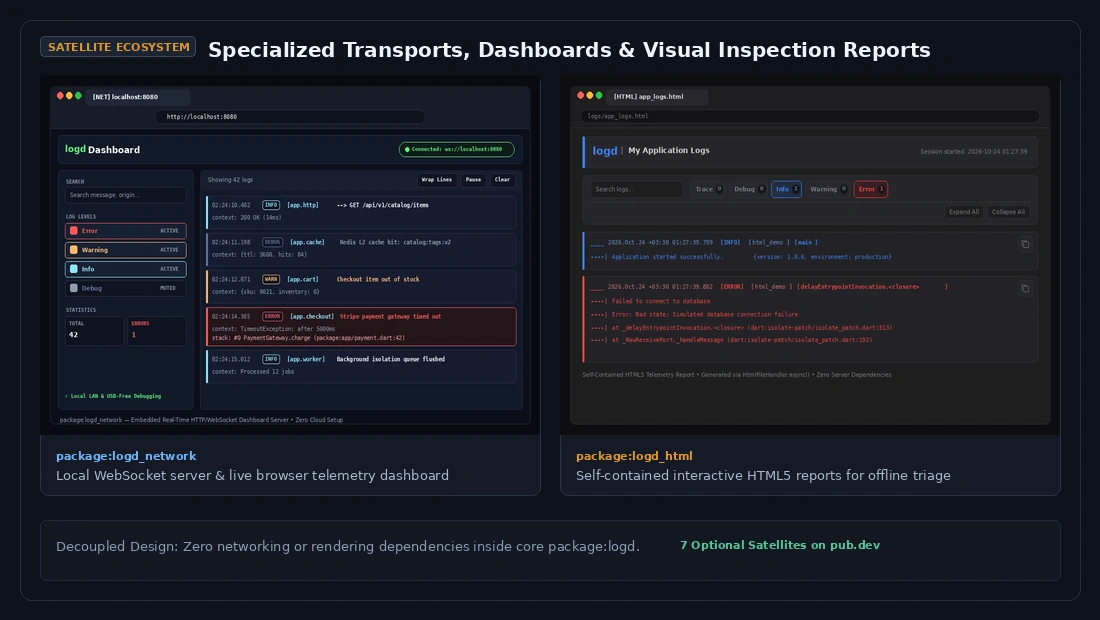
To maintain a zero-network-dependency core, package:logd focuses strictly on the fundamental logging engine. Specialized transports, integrations, and tools are decoupled into seven optional satellite packages:
logd_dio: Interceptor for Dio HTTP traffic, supporting automatic credential redaction, monotonic timing metrics, and copy-paste executable cURL generation.logd_sqlite: WAL-mode SQLite database persistence with embedded terminal table query inspection.logd_network: Local development server providing an embedded browser dashboard with real-time WebSocket telemetry streaming.logd_toon: Token-optimized format designed specifically for LLM context windows and agent workflows (detailed in Section 7).logd_html: Self-contained interactive HTML5 report generator for post-mortem debugging and offline session inspection.logd_markdown: GitHub-Flavored Markdown formatter designed for CI/CD pipeline summaries and automated PR reports.logd_linters: Custom Dart analyzer rules and quick-fixes that enforce logging hygiene and prevent rawprint()statements at compile time.
9. Getting Started
A standard configuration can be initialized with minimal setup:
Final Thoughts: Logging as Infrastructure
Observability requirements inevitably scale with architectural complexity. But as an application matures, the core engineering challenge remains constant: how to maintain deep, actionable visibility into a running system without having that visibility compete for the very resources it measures.
By decoupling formatting and I/O into background isolates, resolving hierarchical policies through cached bitmasks, and isolating failure domains, observability ceases to be a performance compromise. It becomes true infrastructure—quiet, dependable, and completely orthogonal to the business logic it serves.
- Interactive Project Case Study: Interactive Specimen Dossier (/projects/logd)
- GitHub Repository: github.com/pccria/logd
- pub.dev Package: pub.dev/packages/logd
- Architecture Documentation & Recipes: github.com/pccria/logd/tree/master/doc
All packages are available on pub.dev. I welcome your feedback, critiques, and contributions as the project continues to evolve.